Correlation Visualizer
Downloads
Installation Note
When installing the program, you will be asked whether you wish to install it for yourself (as a user), or for everyone who uses the machine.
If the machine on which you are installing this program is your own personal machine, not managed by anyone other than yourself as the de facto 'administrator', then choose:
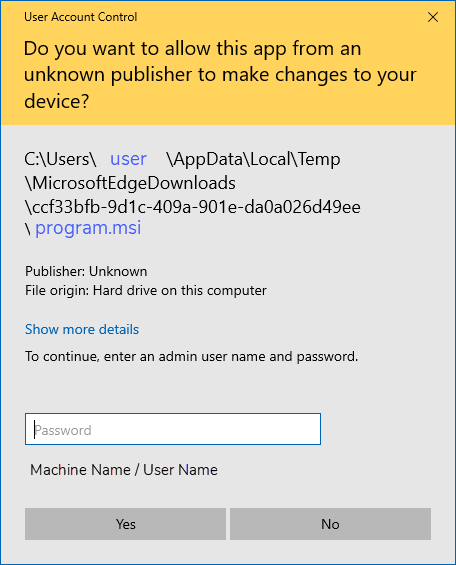
If you try to install the program using option 2 on a machine 'managed' for you by an external IT department/administrator, and you have not been given administrator privileges yourself, then you will see a security prompt, asking you for an administrator password - which you will not possess:
In this case, exit the installation and restart it, using option 1 ("Only for me" ).
The installation creates a folder which can be used for storing output graphics and tables ... C:\Users\Public\Corviz Output Files. The first time you attempt to save any results, it automatically opens that subdirectory for you. From then on, should you choose any other preferred folder, the program remembers the last used path.![]() Corviz is a handy graphics-oriented routine that allows you to specify any value you like for a correlation coefficient, and have it generated instantly as a graphical image. You can optionally specify minimum and maximum values for each variable, as well as the means and standard deviation for each, and whether or not generated observations are integers or real-valued (decimal) format.
Corviz is a handy graphics-oriented routine that allows you to specify any value you like for a correlation coefficient, and have it generated instantly as a graphical image. You can optionally specify minimum and maximum values for each variable, as well as the means and standard deviation for each, and whether or not generated observations are integers or real-valued (decimal) format.
However, it also allows you to place cut-scores on each variable axis, and have the relevant Taylor-Russell statistics automatically computed. All results, including relevant regressions and subset correlations are shown graphically as well as numerically in table format. All graphics features are able to be edited (fonts, colours. sizes of objects/text).
The scatterplot graphics provide an option for bubble-plots for integer-valued observations on both variables. You can also compare two tests' validities in terms of their expected efficiencies in selecting 'successful' members of a screened sample.
The program is designed to be used by consultants, trainers, and professionals who might have need for the capability to show correlations to others as 'you can see by eye' effects rather than as abstract indices. To that end, the program allows a user to copy tables and images to the clipboard for immediate cut-and-paste into other documents, as well as being able to save all images and tables into a variety of graphical and file formats.
I have prepared a 23-page application note available for free download, so as to show how this program might be used by technically-minded consultants (or their R&D people providing more easily understood summary slides for them) in competitive sales presentations, training sessions and teaching material generation, for showing 'what are the likely consequences' cut-score-setting exercises.
The program is sized for a screen resolution of 1157(w) x 740(h).

 CorViz program manual (~10Mb)
 Download the 32-bit .msi Installation file (~21Mb)
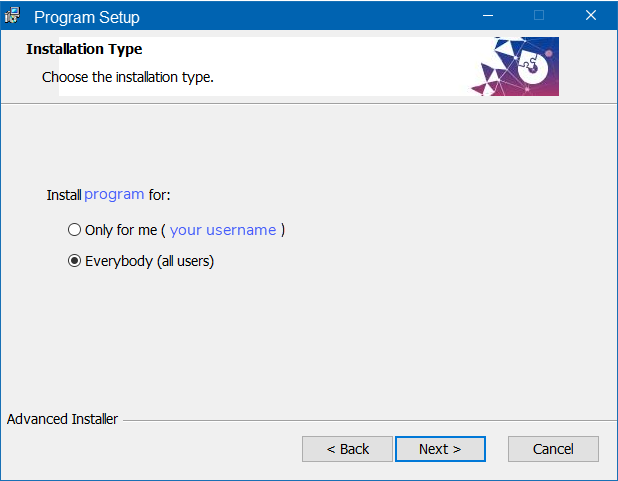
1. "Only for me"
However, if the machine is managed by an 'external' administrator (e.g. your employer's IT or university IT dept.), then choose:
2. "Everybody (all users)"