Bootstrap Significance for Gower + KSD coefficients
Downloads
Installation Note
When installing the program, you will be asked whether you wish to install it for yourself (as a user), or for everyone who uses the machine.
If the machine on which you are installing this program is your own personal machine, not managed by anyone other than yourself as the de facto 'administrator', then choose:
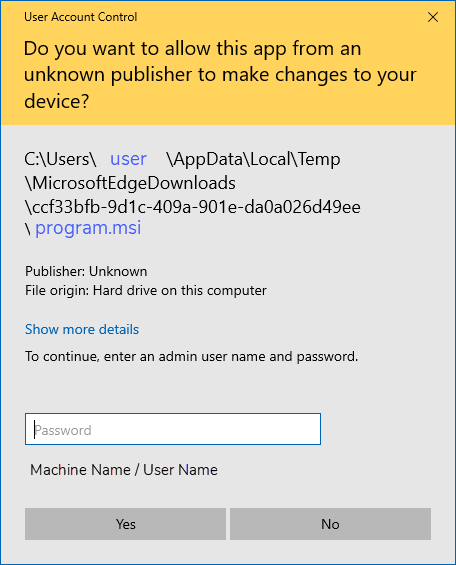
If you try to install the program using option 2 on a machine 'managed' for you by an external IT department/administrator, and you have not been given administrator privileges yourself, then you will see a security prompt, asking you for an administrator password - which you will not possess:
In this case, exit the installation and restart it, using option 1 ("Only for me" ).
The installation creates a folder which can be used for storing output graphics and tables ... c:\users\public\Bootstrap Output. The first time you attempt to save any results, it automatically opens that subdirectory for you. From then on, should you choose any other preferred folder, the program remembers the last used path. This program enables a user to determine the likelihood of obtaining an agreement coefficient, as high or higher than that observed, by chance alone. The agreement indices currently available for analysis are the Gower index, the Kernel Smoothed Distance (KSD-s),and the double-scaled euclidean similarity (DSE-s) index.
It does this by creating samples of random data, with a desired number of cases per sample, corresponding to the particular measurement range of the data from within which the original coefficient was calculated. For each sample, a coefficient is calculated. The number of samples should be sufficient to provide an empirical sampling distribution of coefficients, in order that the estimated occurrence probability of the target coefficient is robust. Anywhere between 5,000 to 20,000 samples is usually sufficient to achieve this (giving you a frequency distribution comprising 5,000 or 20,000 coefficients).
This is the essence of "bootstrapping", generating samples of data from some specified statistical distribution or the sample data themselves (taking a subset of the dataset each time), and constructing a frequency distribution of coefficients found from the samples so that you can determine how likely it is to have observed your 'target' coefficient, by chance alone.
Instead of creating artificial null or alternative hypotheses, we simply determine the likelihood of a coefficient occurring if we were to calculate it from random data. We don't need to assume a sampling distribution for the target coefficient as we construct it empirically, tailored to the particular sample size, measurement range, and type of data (integer or real-valued numbers) we have at hand.
We can also take the same approach if we want to determine whether the magnitude of the difference between two coefficients could have occurred by chance alone. To do this, we specify the two coefficients we have in mind, and their respective sampling details. We then generate say 10,000 samples for each constrained-specified coefficient, taking the difference between them for each pair of samples. This "difference distribution" forms the frequency distribution against which we compare our observed difference. Again, the question we wish to answer is "what is the likelihood of observing a difference between two coefficients as high or higher than that observed, by chance alone?".

 Boostrap program manual (~3.8Mb)
 Download the 32-bit .msi Installation file (~7Mb)
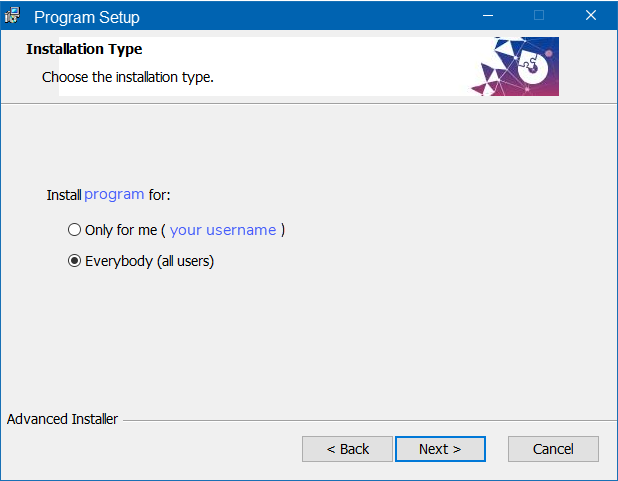
1. "Only for me"
However, if the machine is managed by an 'external' administrator (e.g. your employer's IT or university IT dept.), then choose:
2. "Everybody (all users)"